The crypto market has been witnessing a bloodbath since December last year. According to a report, the panic sell-off has wiped out over $2 trillion worth of digital currencies, making the global crypto market cap fall below $1 trillion on June 13, 2022. Talking about the world's number one cryptocurrency, it had reached its all-time high at $69,000 but has been in a major downtrend since November 2021. Similar to Bitcoin, Ethereum (ETH), Shiba Inu, among others have been dropping significantly. Cryptocurrency prices in India today (16 Jun 2022).
As Bitcoin is the number one digital currency, most investors have invested their hard-earned money in it, as compared to ETH, Solana and others. So investors and swing traders are keen to know about the future price levels of Bitcoin. And one question that every investor and trader would have on their mind is 'Will the price of Bitcoin drop to $12,000 or $6,000.
Well, the honest answer is nobody knows that. These markets are controlled and highly manipulated. But one thing investors and traders can do to make money in this market is to react by monitoring price action at key levels by looking at the chart, look for a certain break in market structure and place their buy or sell bet accordingly. It is important to note that these markets involve high risk. So it is highly recommended to learn how to read the charts first, before putting any of your money. So coming to the question, Will BTC/USD drop to $12,000?
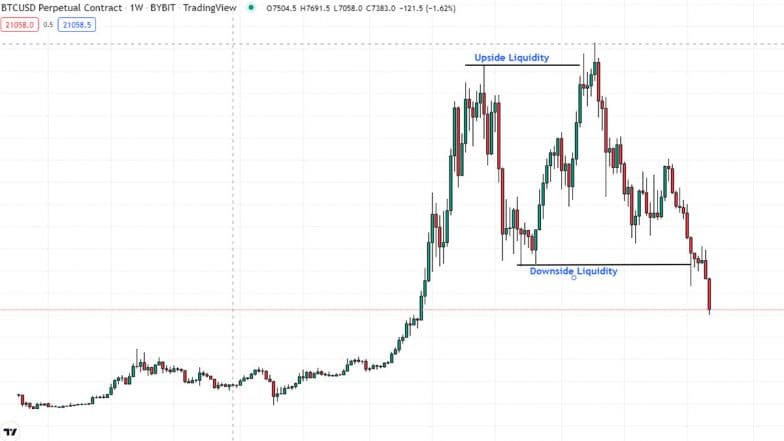
At the time of writing this article, Bitcoin is trading at $21,140. If we look at the BTC/USD weekly chart all the way back to November 2021, when Bitcoin traded to the $69,000 level, it took all the liquidity which was resting above the $64,000 level. Now you would be wondering what is liquidity. Well, liquidity is what moves the price. Liquidity is buy or sell stops that traders or investors have placed to protect their positions. So after taking the upside liquidity, the price came for the downside liquidity, which was at $29,000. As the downside liquidity is taken, the price can now come for the upside liquidity again, which could be at the $32,300 level.

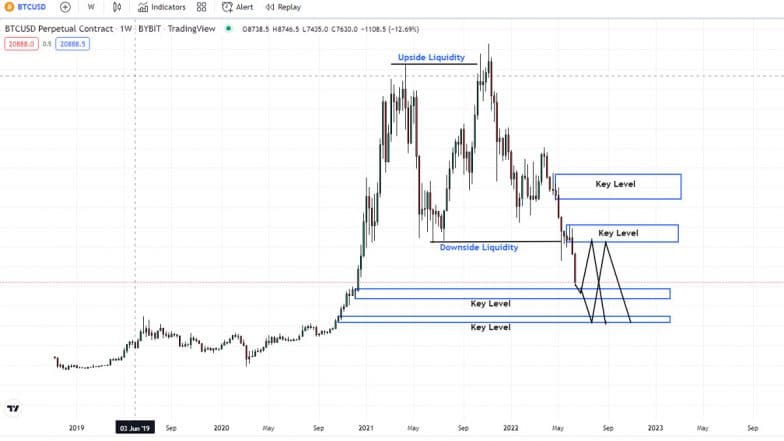
Also, there are two key levels, as shown in the below chart. So the price can react to any of these levels and trade into another key level, which is to the upside (at $29,000).

If the price fails to break the $29,000 level, then it can drop to the $12,000 level. And if the price breaks the $29,000 level, then it can rise to another key level at $37,000 and then drop to $12,000. It is worth noting that this is not a financial advice, and you should have a good knowledge and understanding of the markets before you risk your money.
(The above story first appeared on LatestLY on Jun 16, 2022 05:49 PM IST. For more news and updates on politics, world, sports, entertainment and lifestyle, log on to our website latestly.com).


 Quickly


